
At a time when the ecological transition is becoming a global priority, integrating Green IT into website development is becoming a must. This approach encompasses optimizing resources, reducing energy consumption and improving the efficiency of digital processes. A tool like GreenIT-Analysis enables developers to measure and improve the ecological impact of their websites by providing accurate data and tailored recommendations.
Thanks to this approach, it is possible to reconcile digital performance and respect for the environment, while meeting users’ growing demands for more sustainable services.
We invite you to discover how to implement and use it, as well as how to use GreenIT-Analysis-cli.
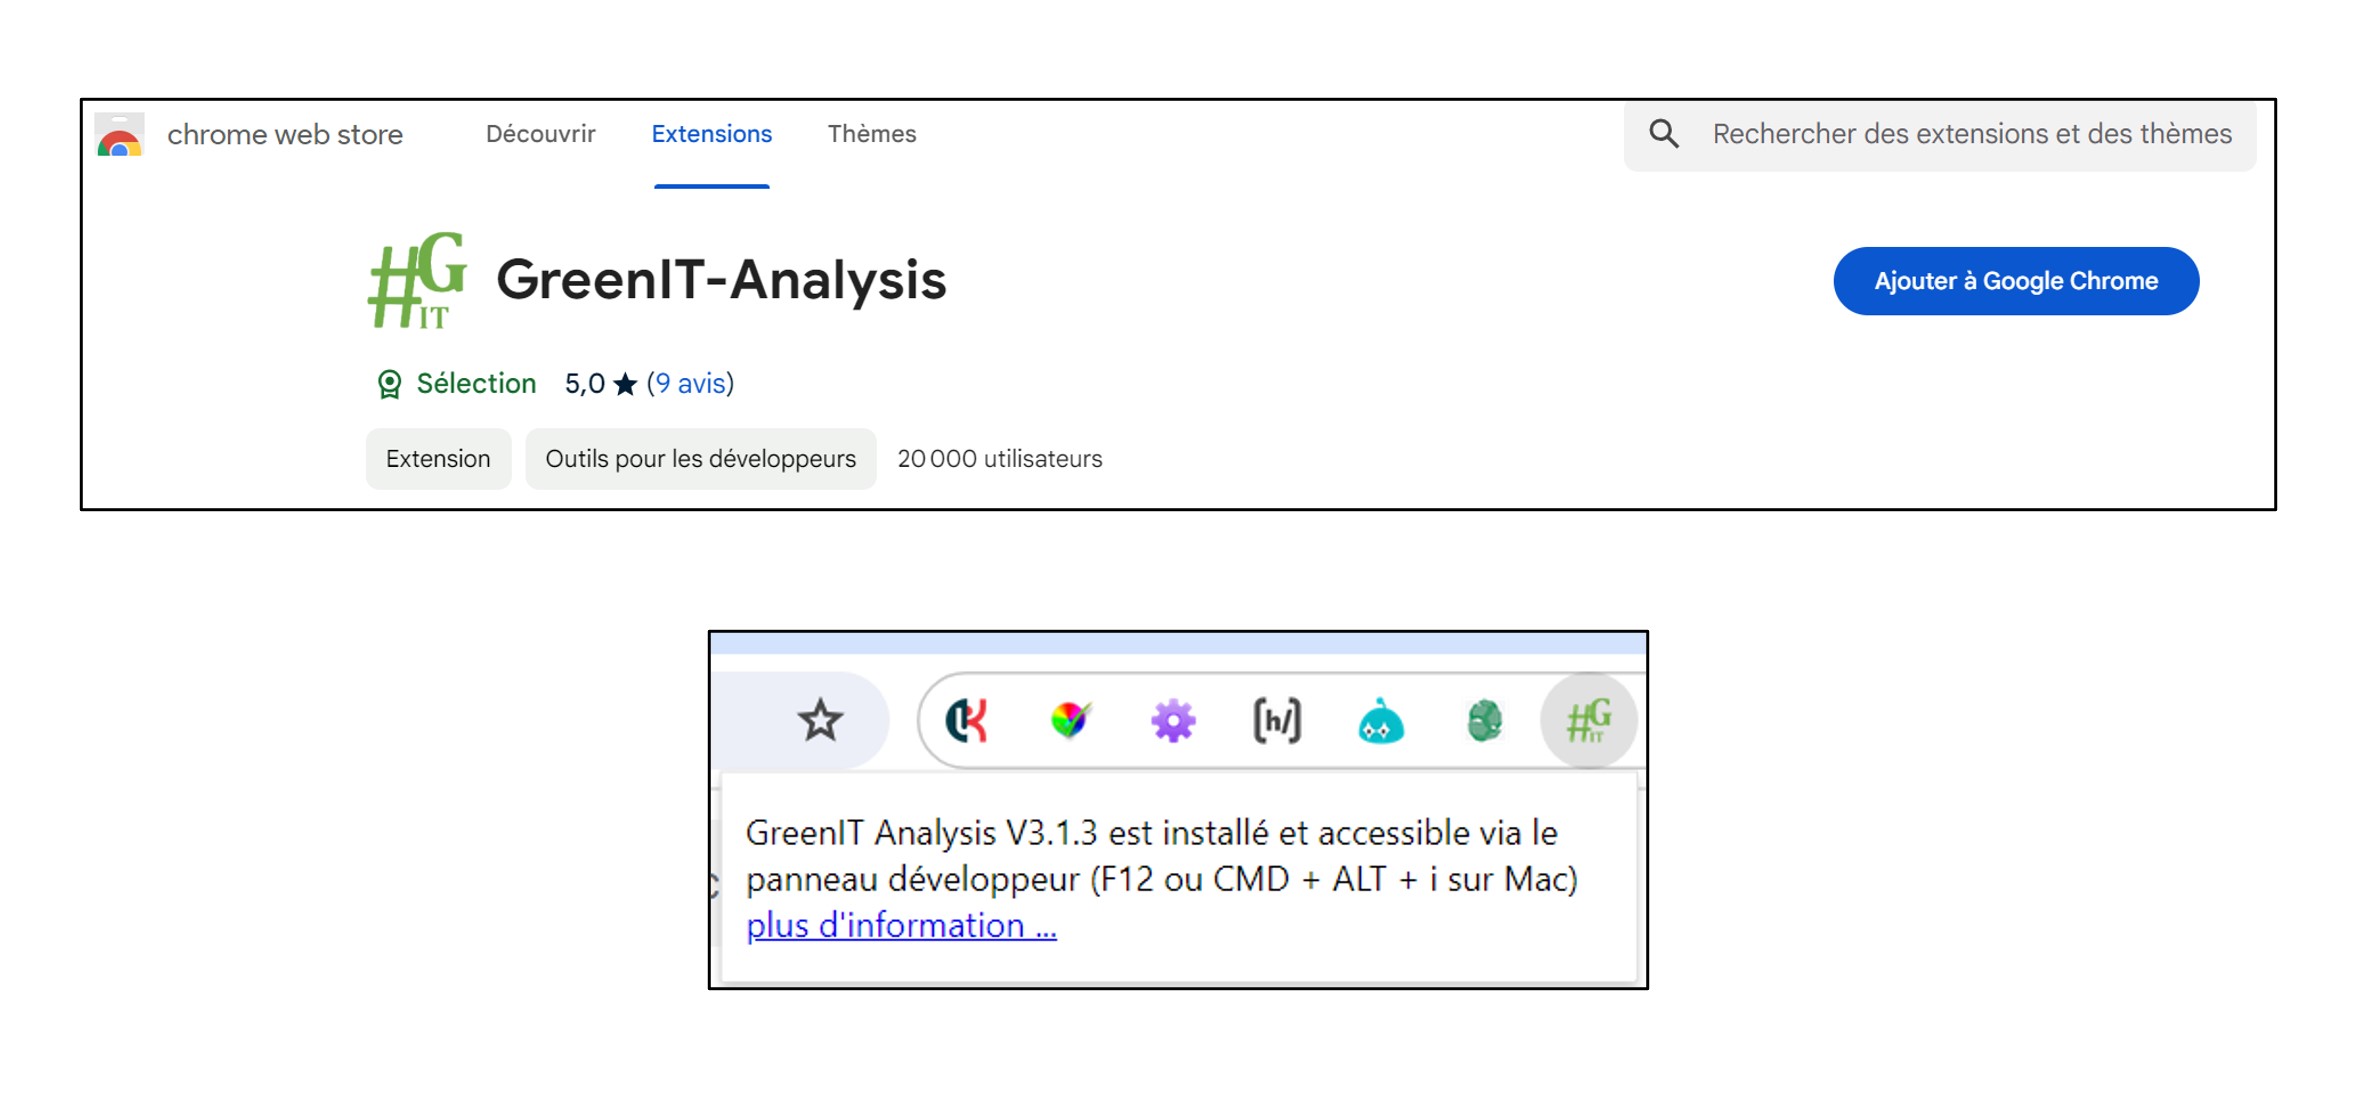
GreenIT-Analysis, what is it?
GreenIT-Analysis is an extension to the Google Chrome and Mozilla Firefox browsers.
This free extension allows you to :
- Measure the EcoIndex of a website as defined by the following website : https://www.ecoindex.fr/ecoconception/
- Check the application of web eco-design best practices as defined by the “Collectif numérique responsable”: https://collectif.greenit.fr/ecoconception-web/
In addition to assigning an EcoIndex score (from “A” for the best to “G” for the worst), the extension lets you find out the EcoIndex score of a web page, as well as the water consumption (in cl) and Greenhouse Gas (GHG) emissions (in gCO2) required to display that page.
These metrics may not be useful to track at a given point in time, but can prove to be important as a website is upgraded.
This tool has been compared to other equivalent tools on the market, some of which are chargeable. Feedback from these comparisons was given at the Devfest Lille trade show: GreenIT-Analysis was the tool whose metrics were the closest to the benchmark measurements made during these comparisons.
Add-on installation
Under Chrome, this extension can be downloaded and installed from this link: https: //chromewebstore.google.com/detail/greenit-analysis/mofbfhffeklkbebfclfaiifefjflcpad?hl=fr
For Firefox, the link is: https: //addons.mozilla.org/fr/firefox/addon/greenit-analysis/
It should be noted that the remainder of this document concerns the use of the extension under Google Chrome, even if the operation under Firefox, which we were able to test, is completely similar.
Installation is straightforward: on the Chrome Web Store, simply click on the “Add to Google Chrome” button, then confirm that you wish to add the extension.
Once installed, the extension is immediately visible in your browser’s list of extensions. There’s no need to pin it. Simply go to the developer panel to use it.
Use of the add-on
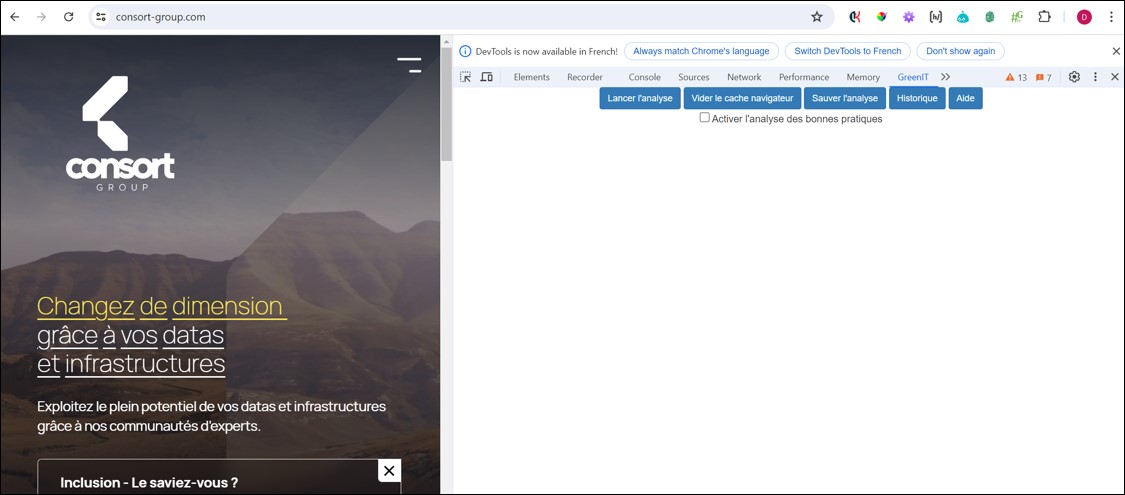
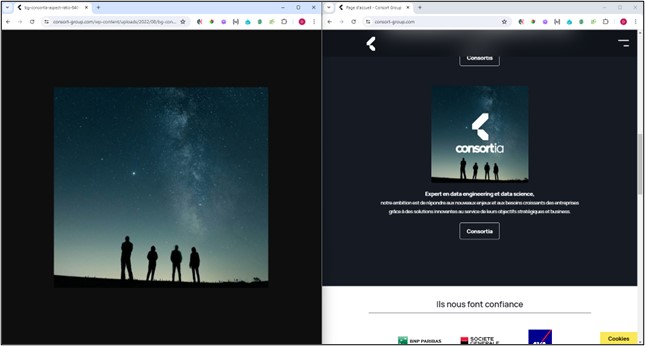
Once installed, simply go to a web page in your browser and open the developer panel (by pressing “F12” on a Desktop PC). Here’s an example with the Consort home page: https: //consort-group.com/
By pressing “F12”, a “GreenIT” tab appears when the extension is installed.
Simply check “Enable best practice analysis”, then click on “Start analysis” to obtain the information specific to this page.
Information available
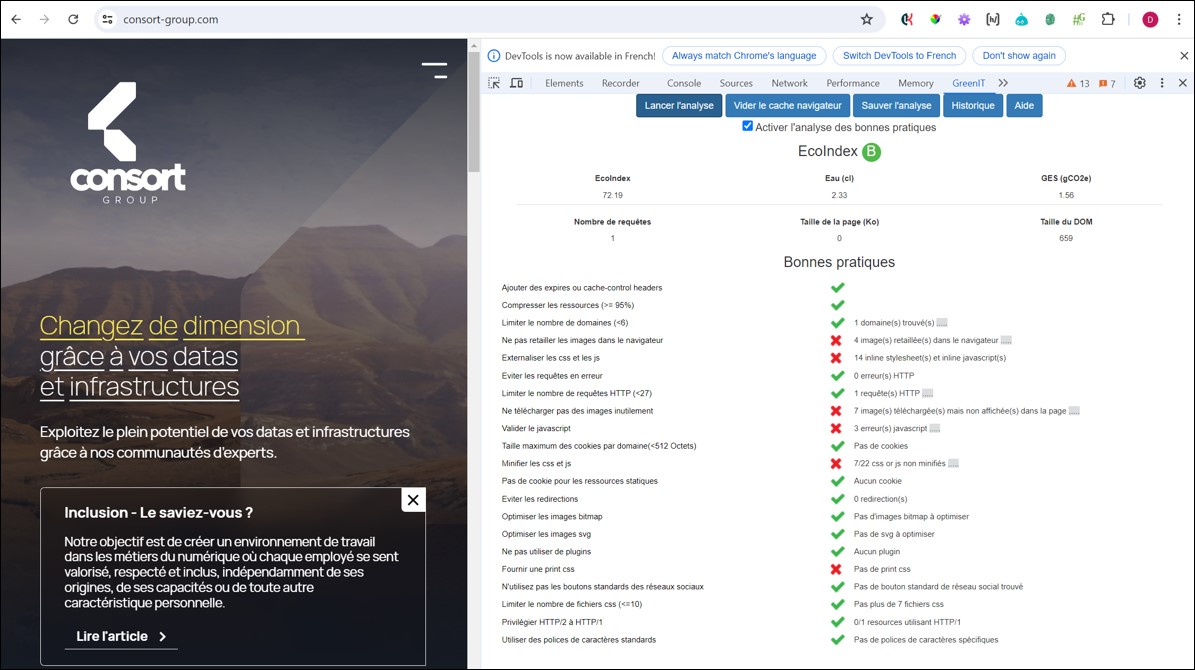
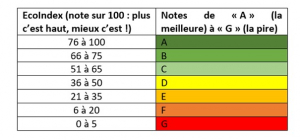
In our example, at the time of writing, the calculated EcoIndex is “B”, for a score of 72.19 out of 100. Below is a table showing the relationship between the EcoIndex score and the resulting letter.
We can also see that displaying this page consumed 2.33 cl of water, and 1.56 gCO2e (greenhouse gases).
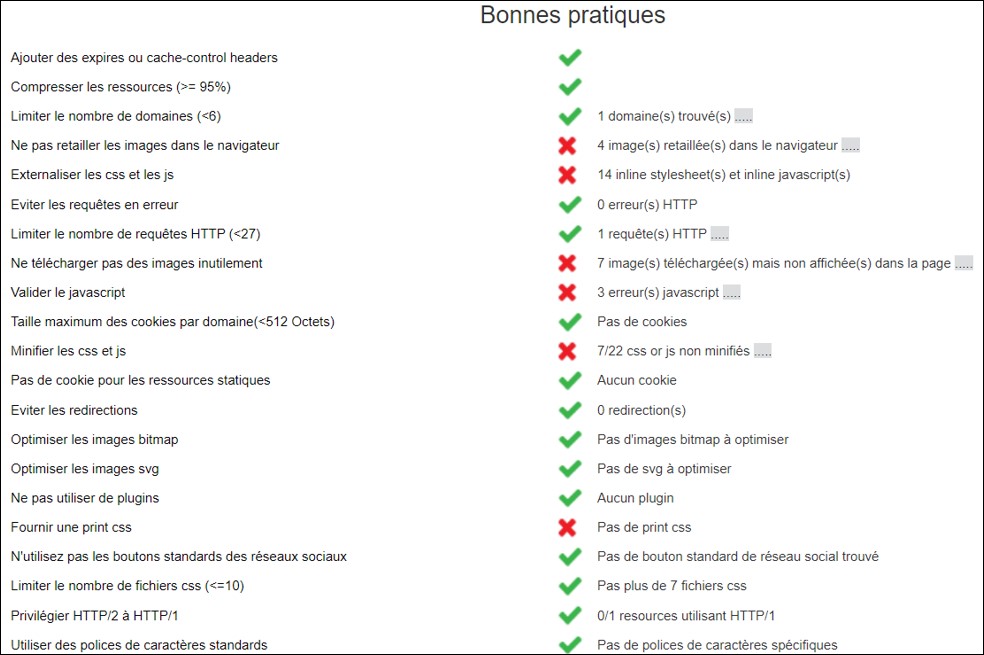
The tool also displays a set of best practices (closely linked to the front end of the web page, and its Webperf). The best practices in question are perfectly readable and will speak to any front-end developer or tester:
Here, the areas for improvement relate to images that should not be resized in the browser, images downloaded unnecessarily (even though they are not displayed), javascript errors, etc…
These reports are accompanied by details when you click on the grey area to the right of the best practice. For example, here’s what you get for images that should not be resized in the browser:

For a better understanding, here’s a screenshot of the downloaded and displayed images : on the left, the downloaded image; on the right, the displayed image.
This extension is a valuable aid to identify areas for improvement or energy consumption failures ; then, a tester can declare them in the appropriate bugtracker, with a severity level in line with the test strategy for his project or product.
GreenIT-Analysis-cli (command prompt), to go further
The above document enables non-technical profiles to use an easy-to-install / easy-to-use extension.
If you want to go even further (and towards CI/CD), you can use the following public Github project: https://github.com/cnumr/GreenIT-Analysis-cli
The aim is to benefit from the previous functionalities. However we can go even further by combining both :
- Command-line execution (i.e. opening up to CI/CD)
- Automated test tool functionalities, in this case Puppeteer, which is included in this Github project.
- Generation of html, xlsx or influxDB (Grafana format) reports.
To use these tools, we’ll need 2 elements :
- An IDE (Integrated Development Environment) -> we’ll be using Visual Studio Code
- node & npm (node package manager)
With these prerequisites, we’re ready to install and use these tools in a node project, under JavaScript, by following the manual Node.js installation procedure, available here: https://github.com/cnumr/GreenIT-Analysis-cl
Use
Once the project has been retrieved locally and opened in VS Code, open the terminal and go to the “GreenIT-Analysis-cli” folder :

The processing input, with the pages to be analyzed, is located in the “samples” folder. The project is supplied with a “greenit-url.yml” file in this “samples” folder. The URLs to be scanned for accessibility are entered in this file :
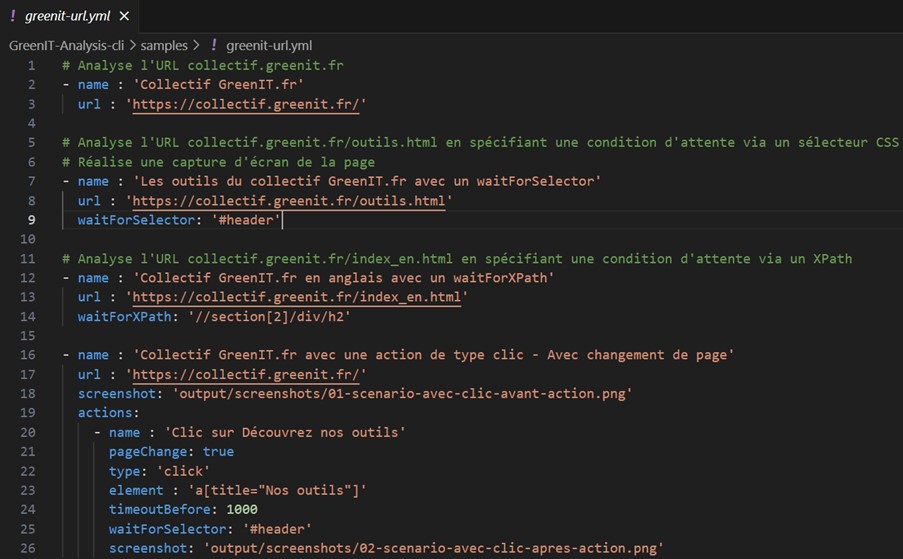
In this example, we can find several URLs to scan, and wait for an element to appear on the screen, using the appropriate Puppeteer methods (waitForSelector, waitForXPath…).
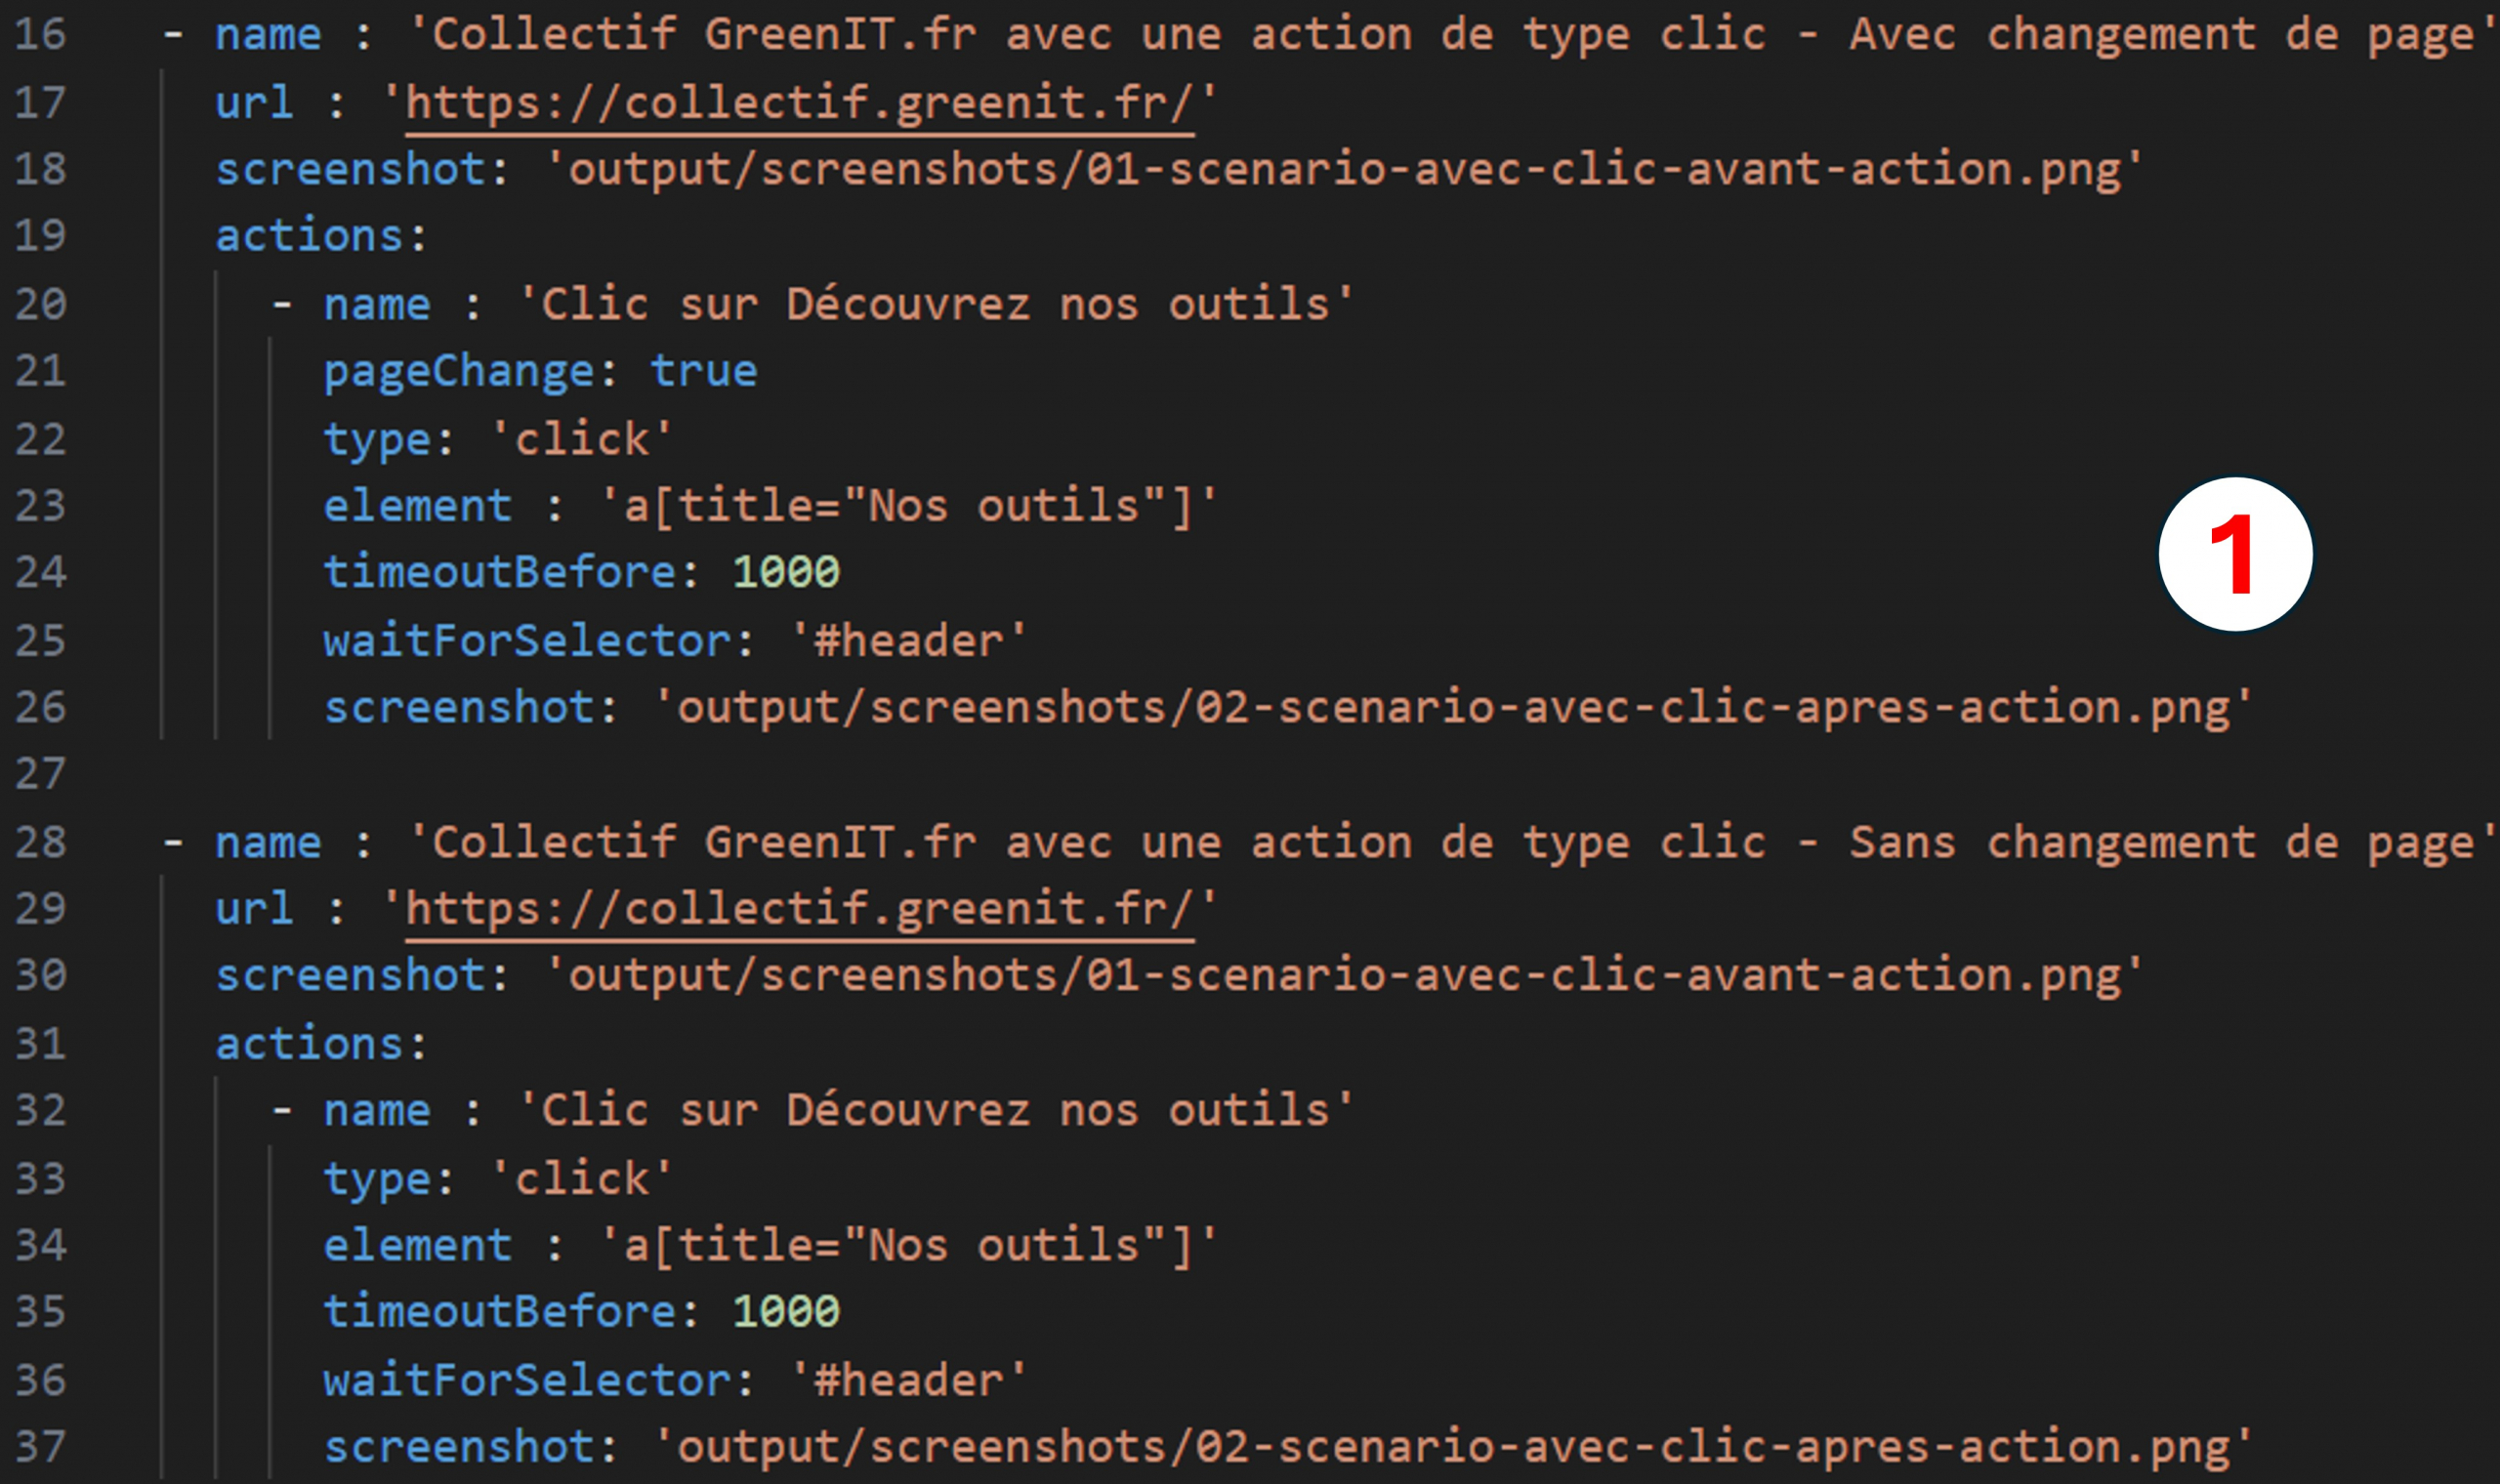
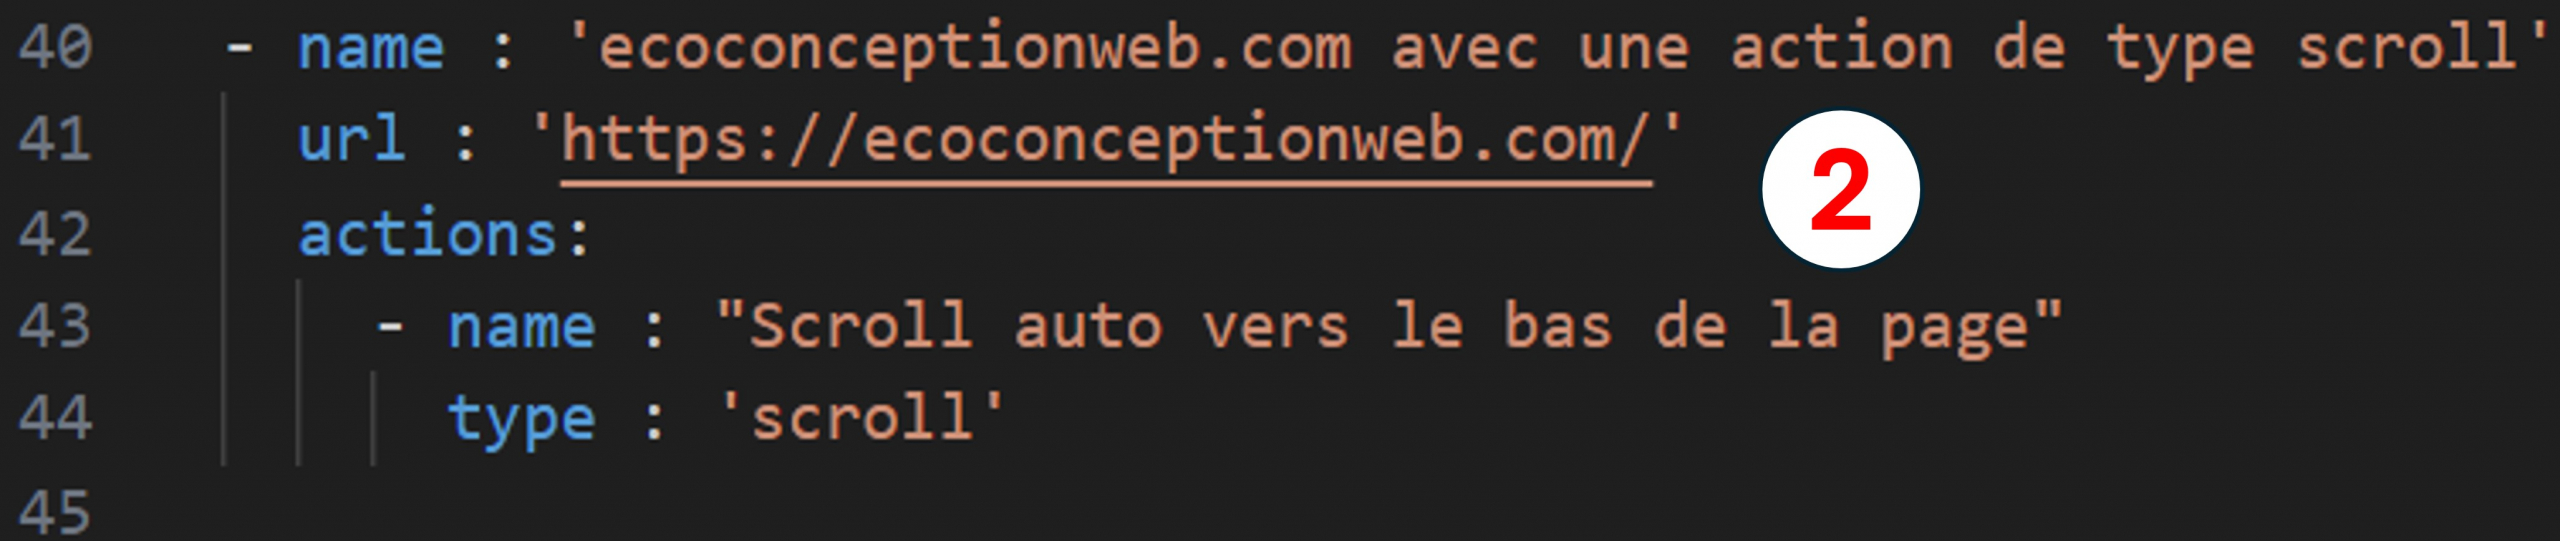
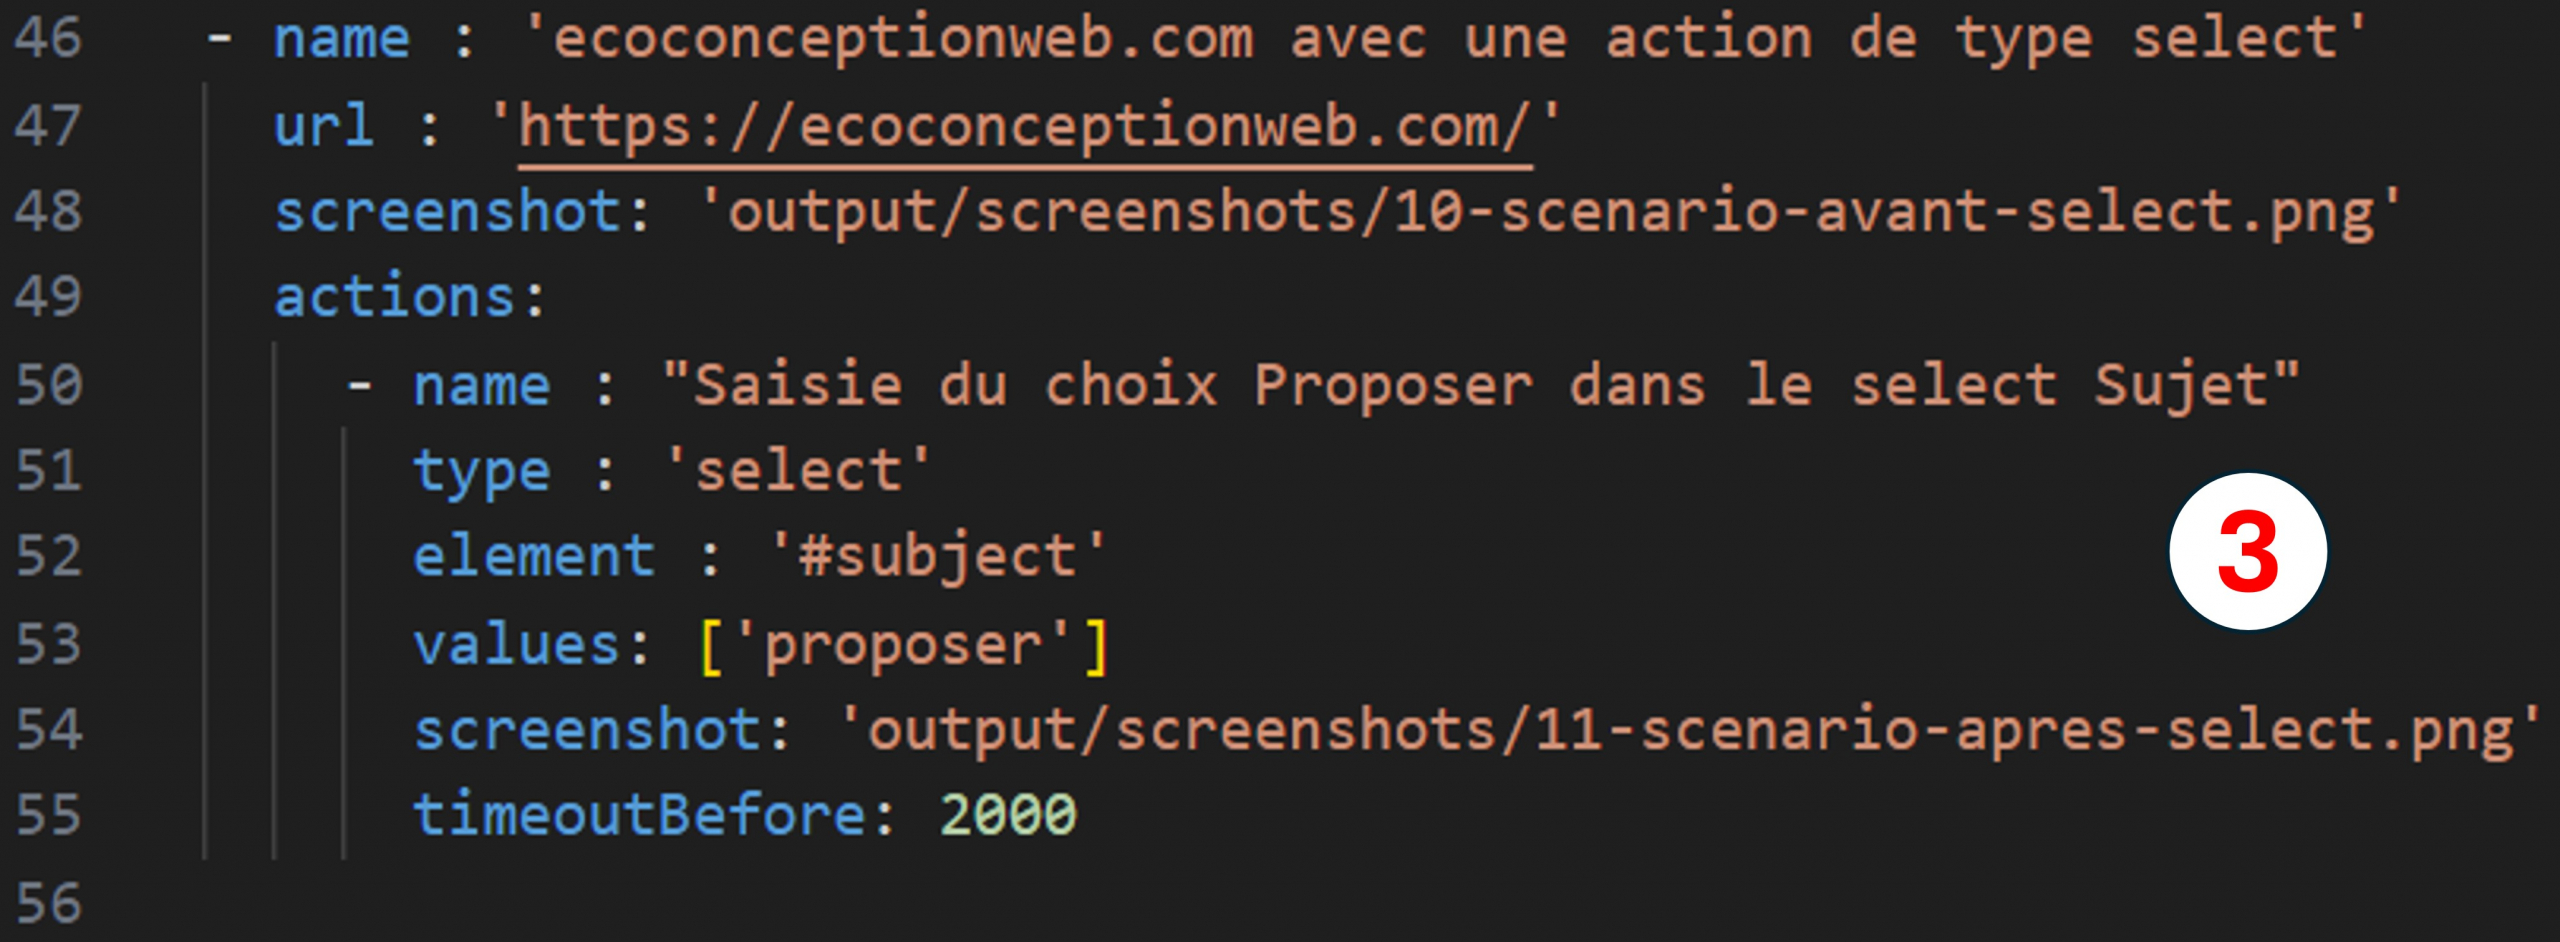
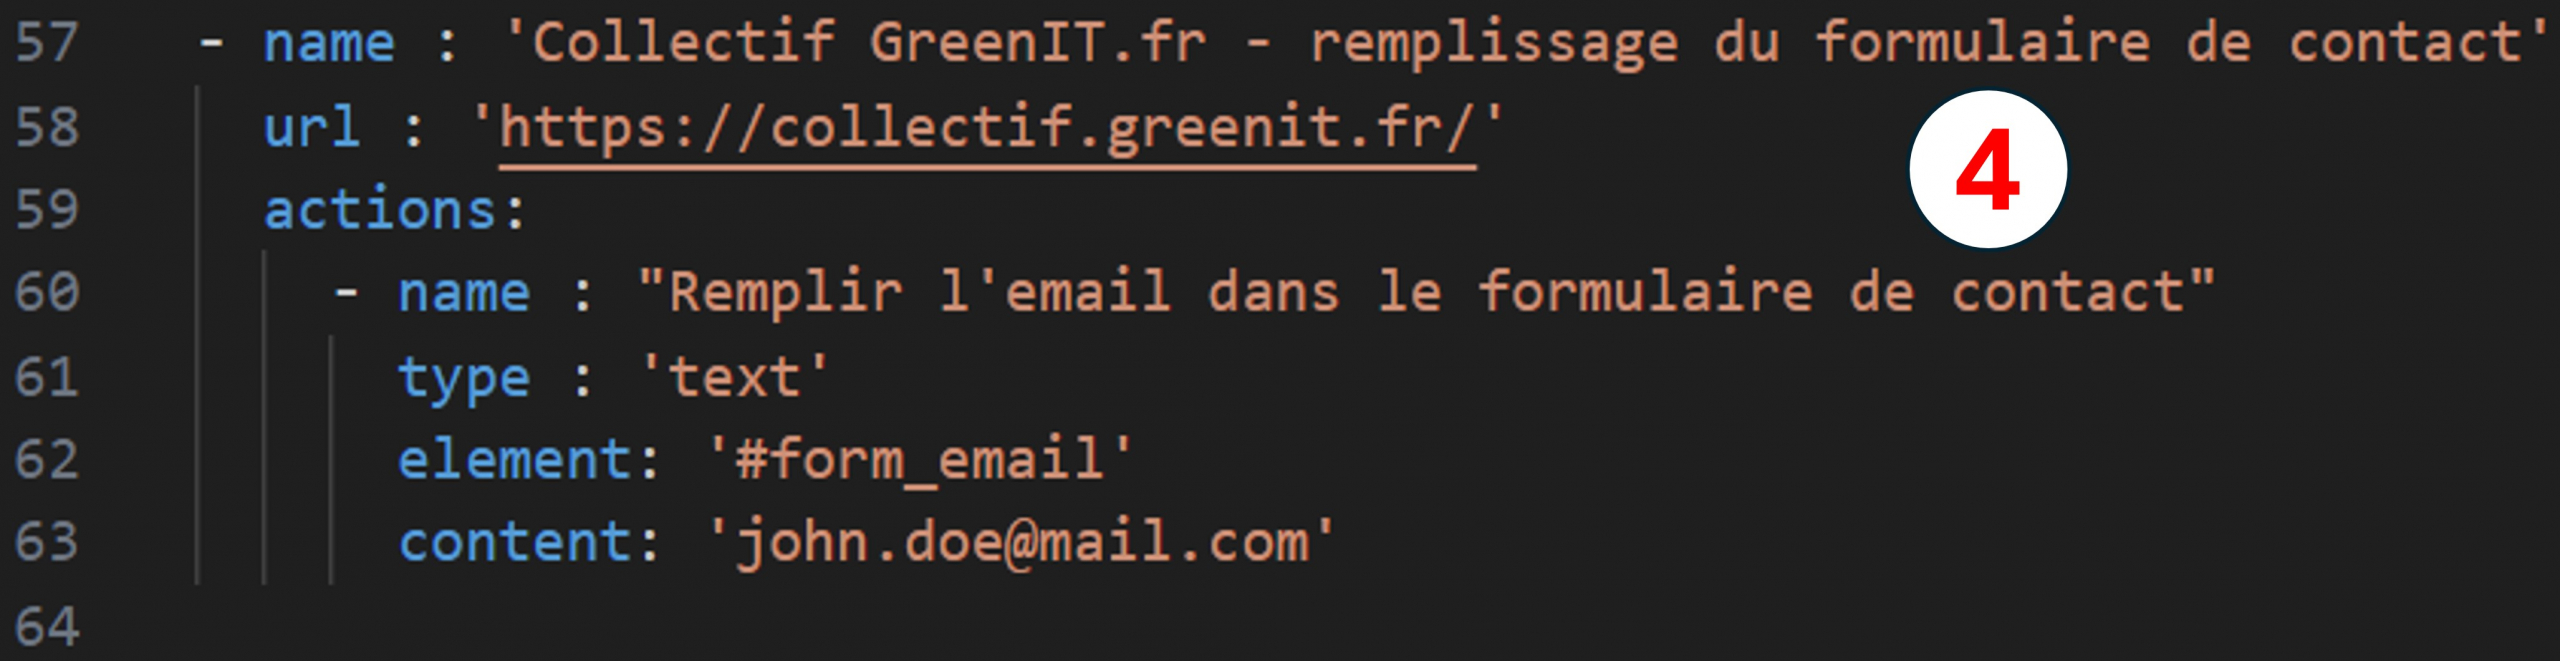
It is also possible to perform actions such as :
- Clicking to change page or not (image 1)
- Scroll down a page (image 2)
- Selecting a value in a listbox (image 3)
- Entering a value in a text field (image 4)
It is thus possible to combine these different actions to create end-to-end scenarios that can be complex.
Preparing the yml file
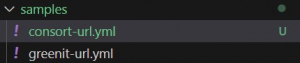
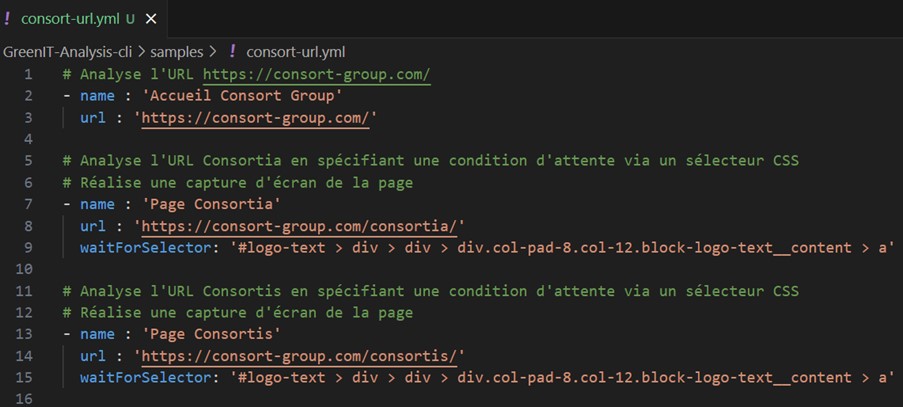
This first file, provided as an example, is a valuable knowledge base related to the use of the tool : we recommend keeping it, and duplicating it to start on other scenarios, as we have done here to have a “consort-url.yml” file.
In this new file, we want to scan 3 pages, which are the Consort home page, the Consortia page, and finally the Consortis page. Our yml file finally looks like this :
Running Green It scans
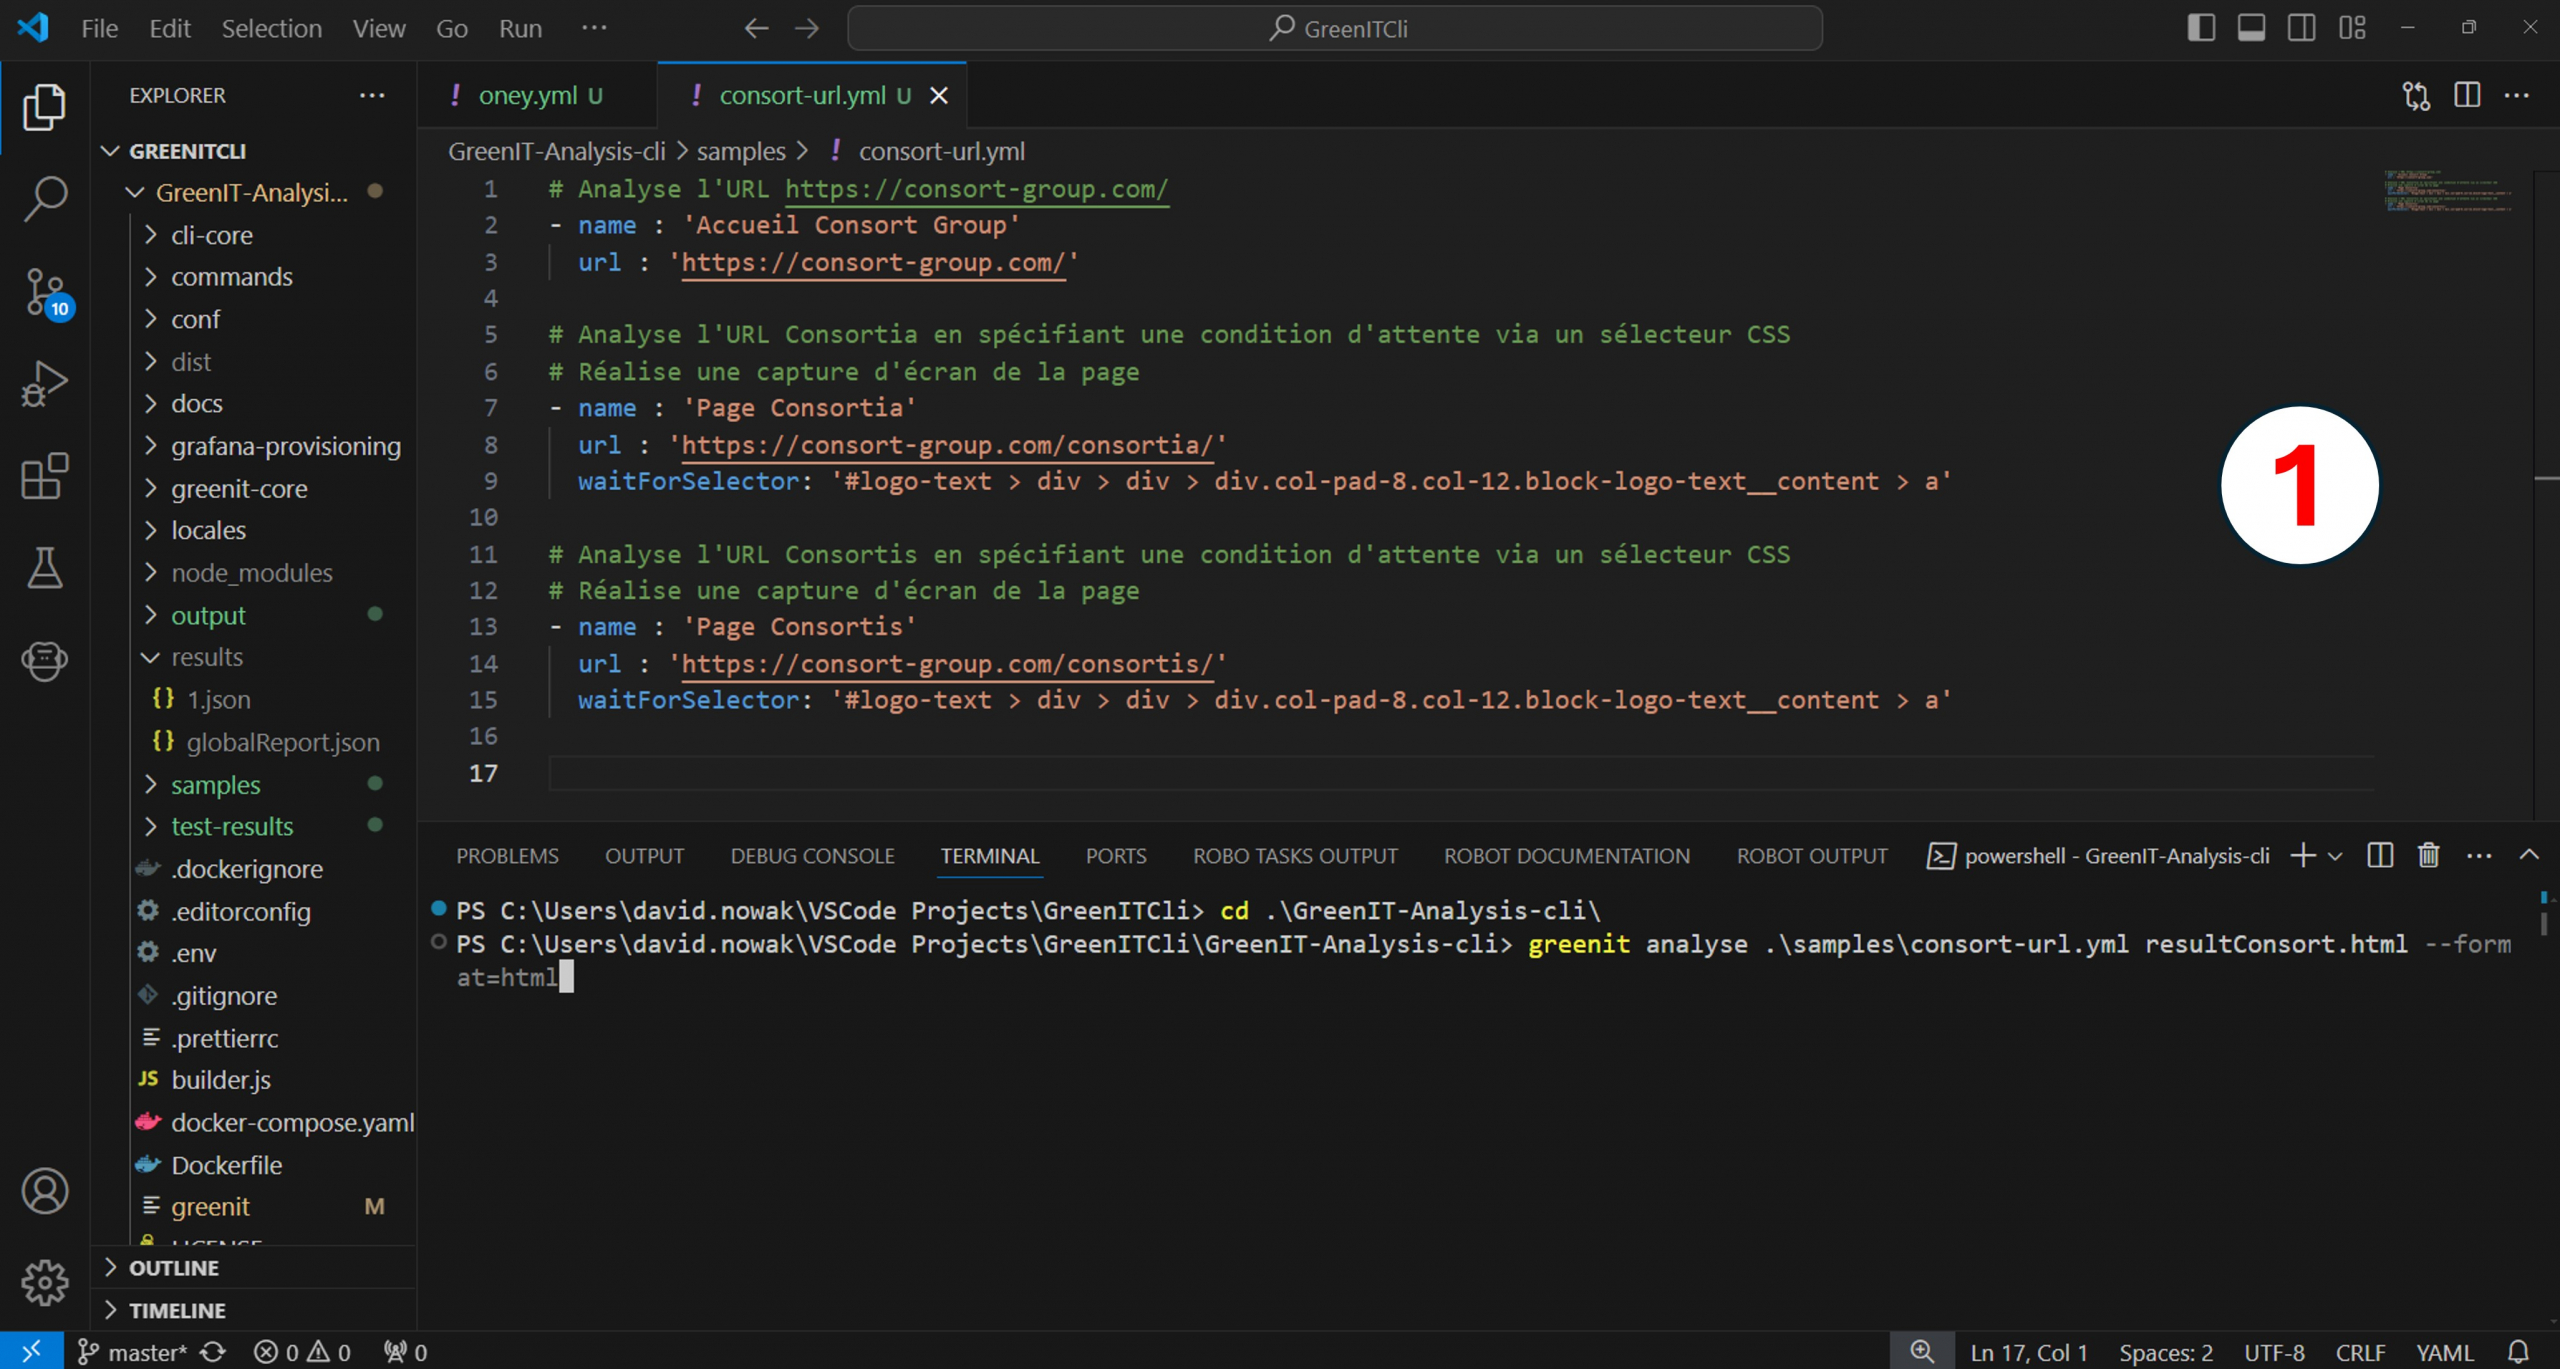
Once the yml file is ready, the treatment is ready to be executed. Execution takes place on the command line, in Terminal VS Code. The command line includes :
- GreenIT analyse
- The path of the input yml file (samples/consort-url.yml in this example)
- The name of the output file, which may have a .html, .xlsx or .influxdb extension.
- The output format specified in the –format (or -f) option: html, xlsx, influxdb or influxdbhtml.
Note that results in the form of json files will also be generated in the project’s “output” folder.
In this example, we’d like to generate an html report via the following command prompt: greenit analyse .\samples\consort-url.yml resultConsort.html –format=html (image 1)
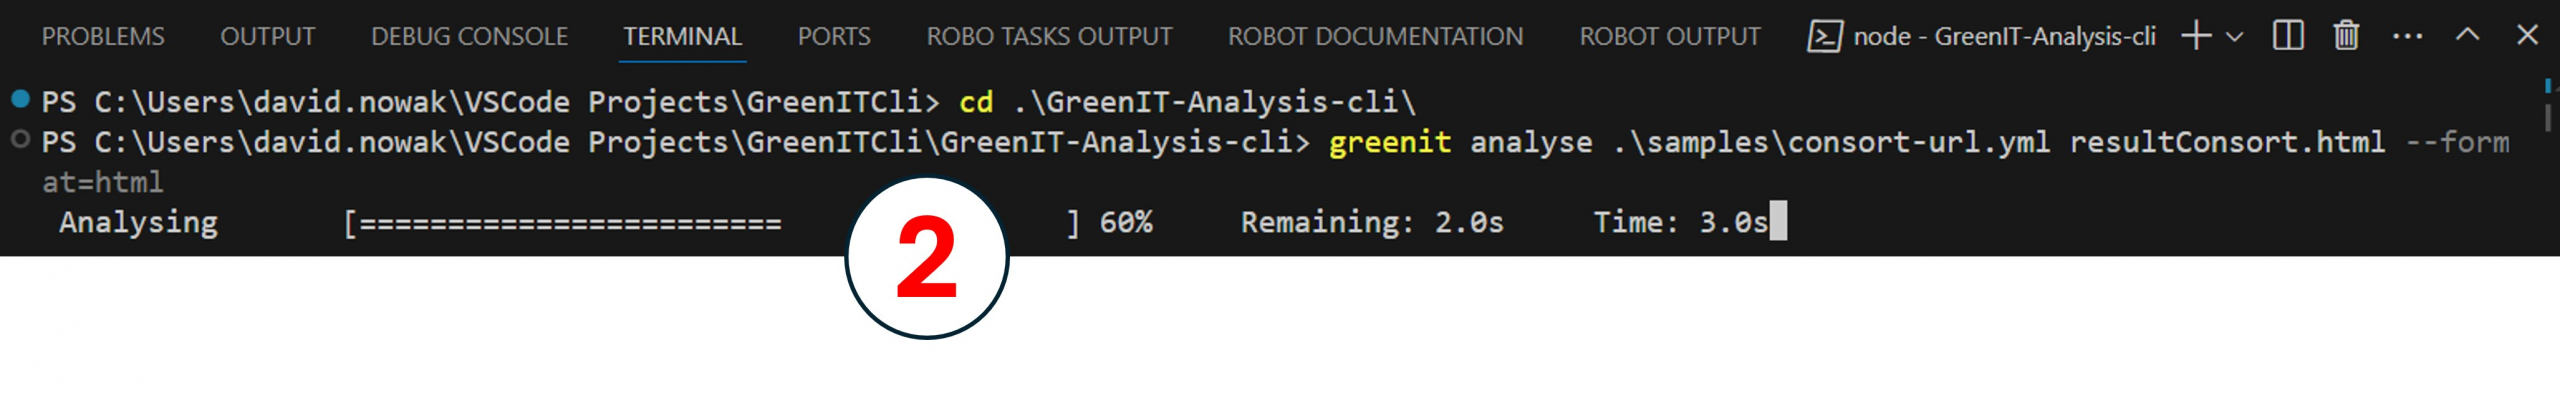
Analysis starts (image 2)
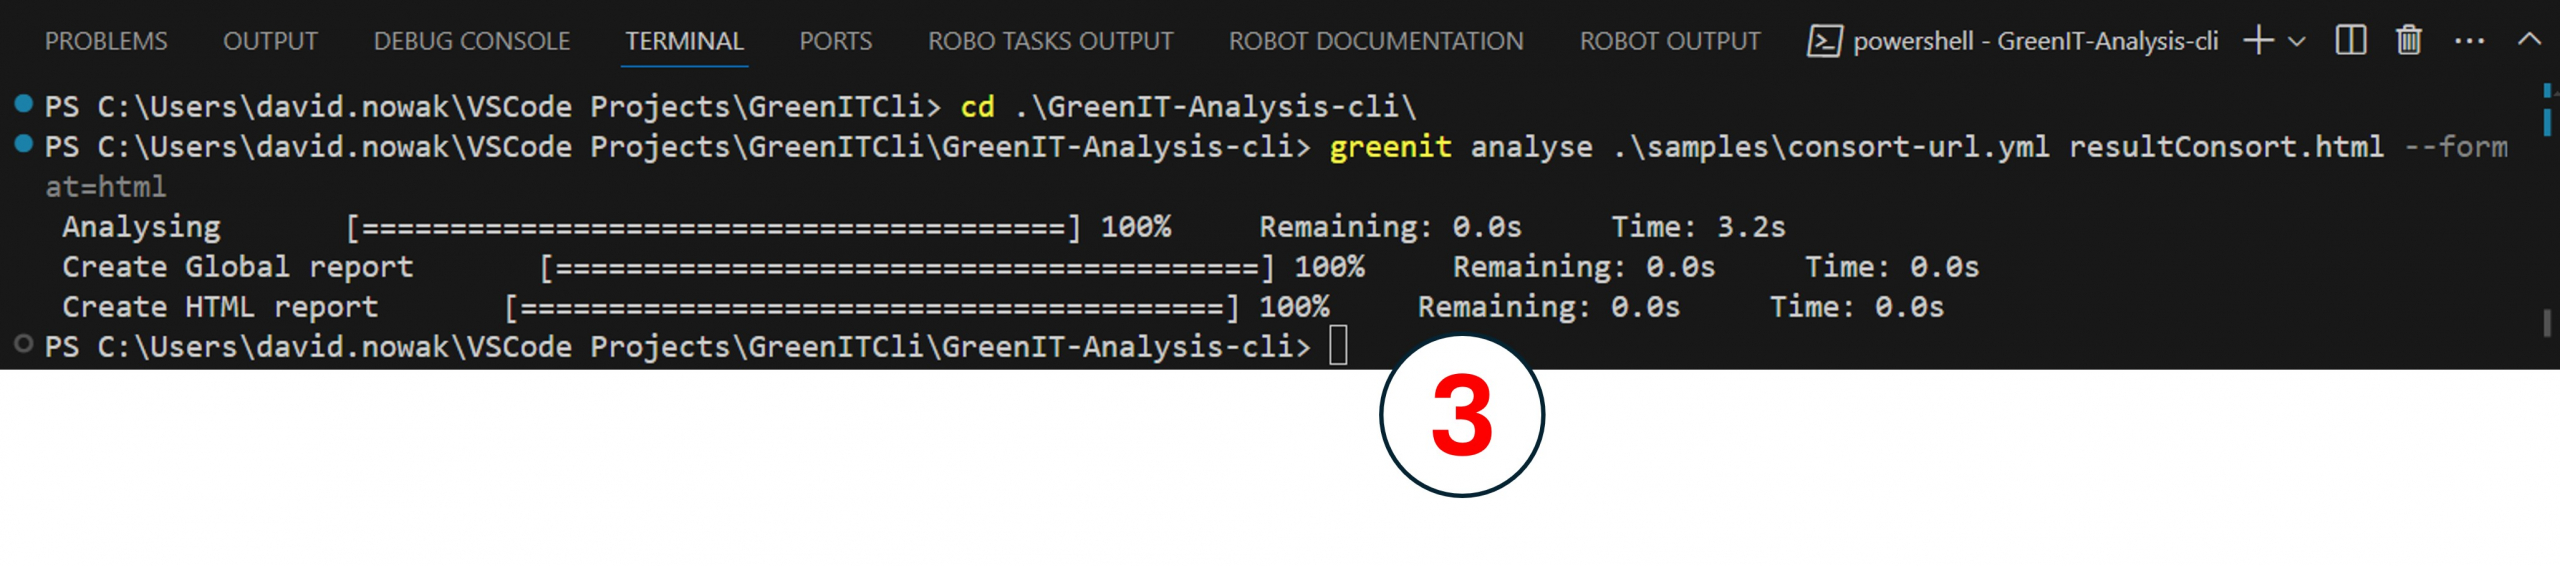
It ends, here in 3.2 seconds (image 3)
Results analysis
4 files are generated here :
- A “resultConsort.html” file
- One file per URL scanned, with details for each URL (here, the Consort home page, the Consortia page and the Consortis page).
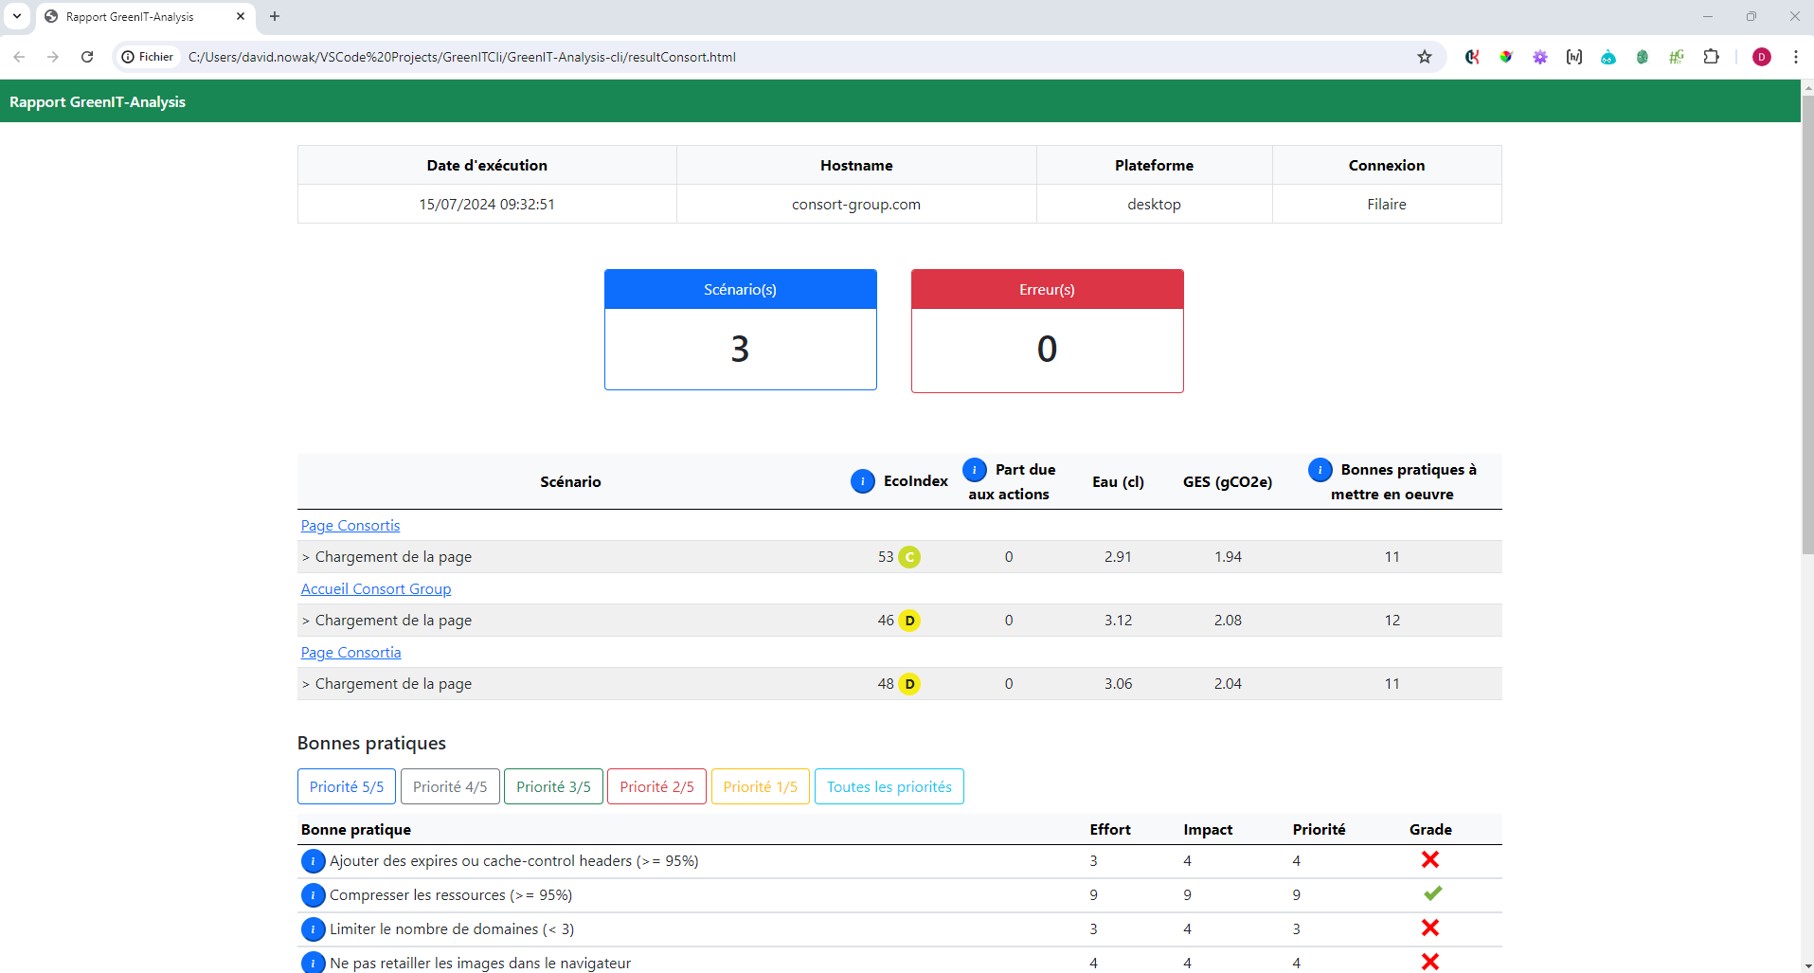
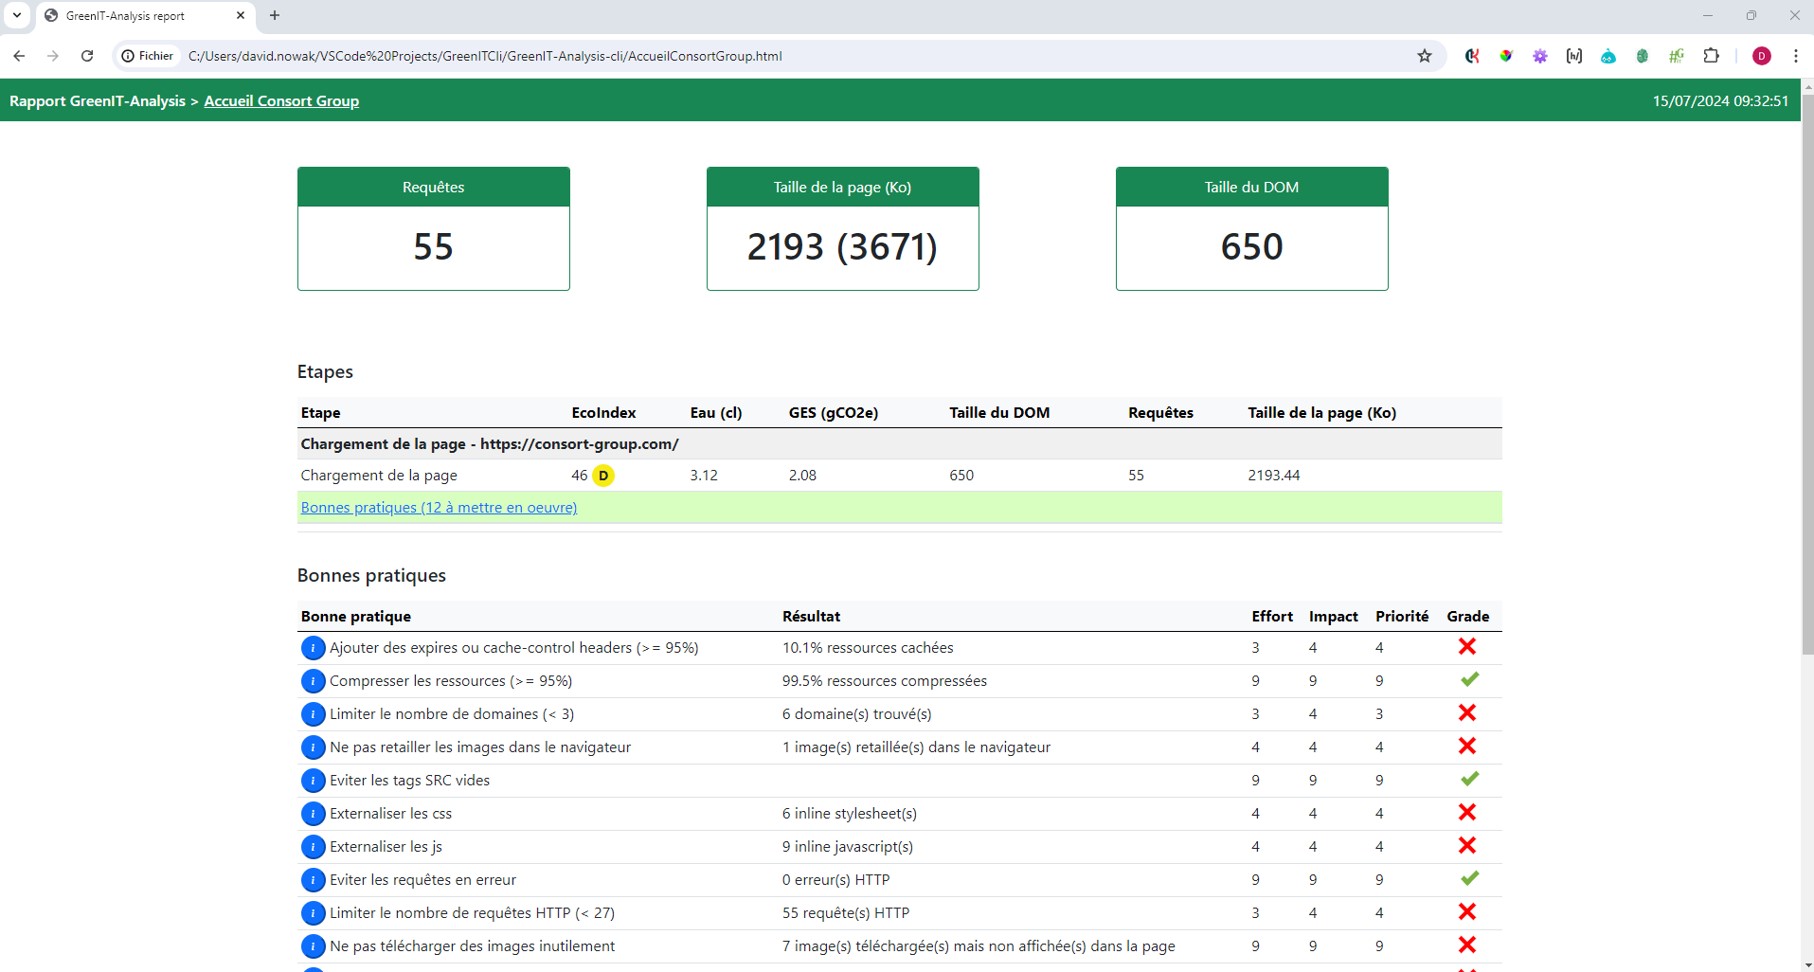
You can then open the “resultConsort.html” file, and even access the details of each page by clicking on the appropriate link. For example, here are the details of the “Consort Group home page.
Here we see an ecoIndex of 46, leading to a grade of “D” on this page. 12 best practices are indicated to improve the ecoIndex. In this example, we recommend adding caches to certain resources, limiting the number of domains, not resizing certain images in the browser, and so on.
If we take the example of images resized in the browser, we can see this :

Here’s a screenshot of the image uploaded to the server, plus the same image displayed on the page :
In addition to the generated html report, the tool also generates 4 json files corresponding to the 4 more readable html files. These are generated in the “results” directory.
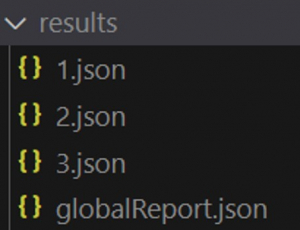
The “globalReport.json” file corresponds to the global html file seen above, then the “1.json”, “2.json”, etc. files correspond to the details of each of the pages scanned.
This generation of json files is interesting, as it enables data to be easily read and historized in order to see the evolution over time of these metrics of ecoIndex value, DOM size, water consumption and greenhouse gas emissions, with a view to integrating a CSR score into an application’s Quality Score calculation, for example.
Also worth reading


A/B Testing : digital performance
Are you having trouble knowing which version of your website or marketing campaign is performing best? What if, instead of relying on gut instinct, you could make decisions based on real data? That's the whole point of A/B Testing!

A new agile ritual : “The 4 amigos »
Consort Group present the promising directions taken by our recent pilot project to deploy an agentic architecture, combining technological expertise, agile methodologies & eco-responsibility, introducing AI as a central player in the design of functional and non-functional test cases.